
Claims 4 min read
Clean Claim Rate: Benchmarks and How to Improve It
Key takeaways
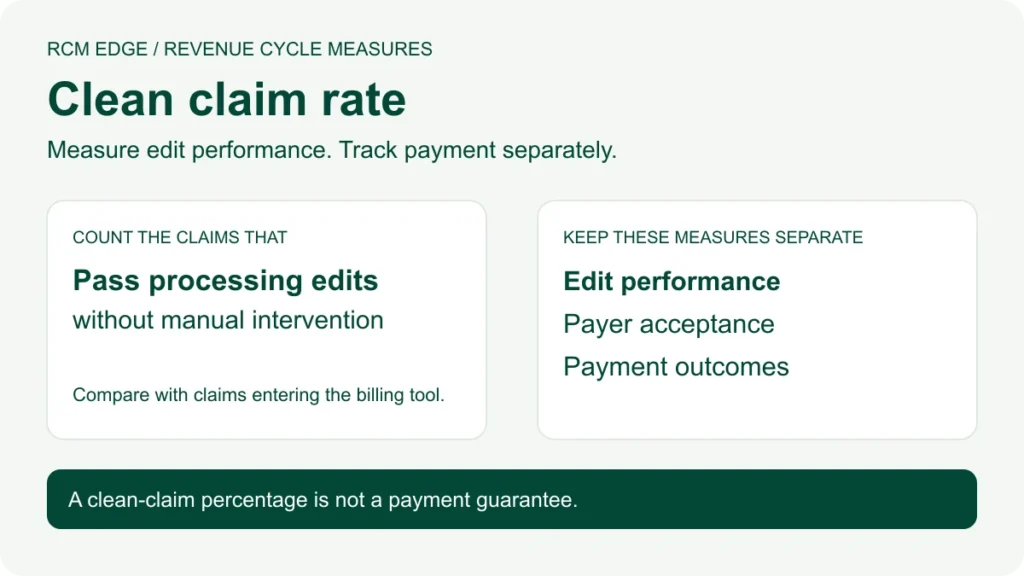
- Clean claim rate measures claims passing processing edits without manual intervention, not claims paid on first submission.
- Use a documented baseline and compare only reports with the same metric definition and claim population.
- Eligibility, prior auth and pre-submission scrubbing are the big levers.
- Pre-submission editing and downstream claim-status follow-up measure different parts of the workflow.
Your clean claim rate is one of the clearest signals of revenue cycle health. Here is how to define it consistently, calculate it, and investigate the work behind the percentage.
What is a clean claim rate?
Under HFMA’s CL-1 definition, clean claim rate measures claims passing processing edits without manual intervention relative to claims accepted into the processing tool for billing. It is not a measure of payment on first submission. Use the HFMA MAP Keys definition and inclusion rules when reporting this metric; label any alternative definition clearly.
How to calculate clean claim rate
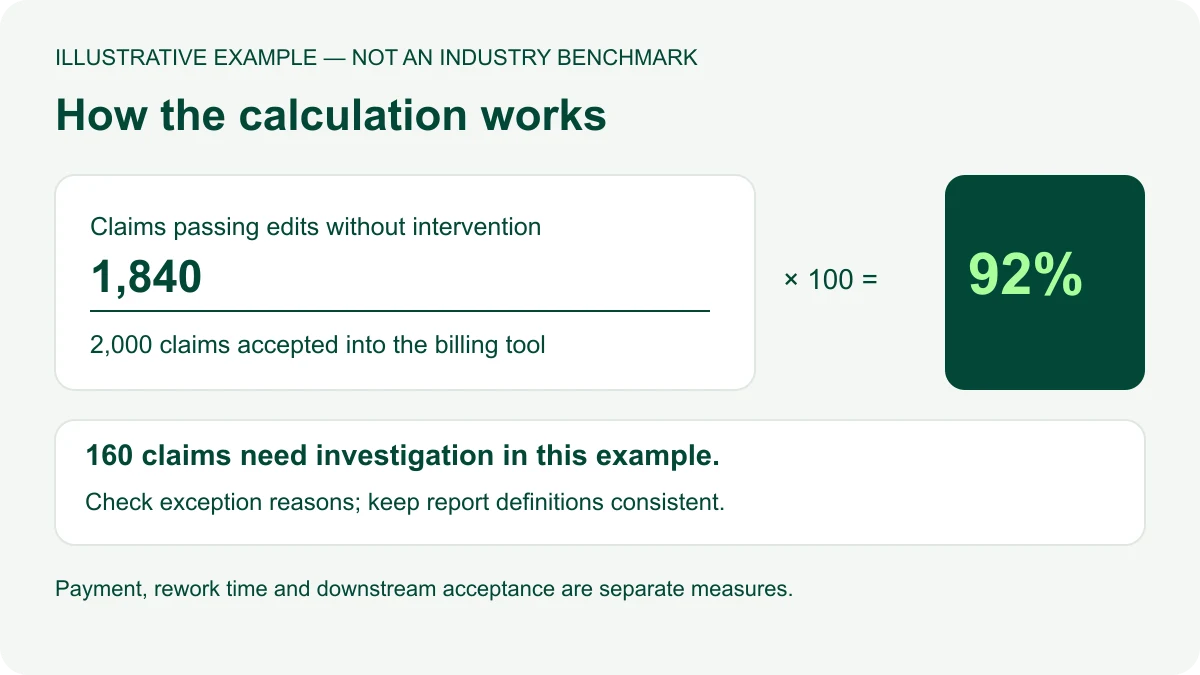
Clean claim rate = (claims passing edits without manual intervention ÷ claims accepted into the processing tool for billing) × 100.
Worked example: interpreting a 92% clean claim rate
Suppose 2,000 eligible claims enter a billing team’s processing tool during the reporting period and 1,840 pass the applicable edits without intervention. The calculation is 1,840 ÷ 2,000 × 100 = 92%. The other 160 claims are the cases to investigate. This is an illustrative example, not an RCM Edge customer result or an industry benchmark.
If 1,900 of 2,000 claims pass next month, the rate becomes 95%: a three-percentage-point improvement. Before attributing that change to automation, check whether claim mix, edit rules, data extraction and counting methods stayed consistent. Track staff time separately; a percentage improvement is not automatically a cash saving.
A practical monthly measurement checklist
- Document the report. Record the source, reporting period, extract date and owner of each number.
- Keep counting consistent. Explain how corrected records, repeat processing attempts and reporting boundaries are handled.
- Review exceptions. Group intervention work by actionable cause and inspect a sample with the responsible team.
- Test one improvement. Record the change, its owner and start date so subsequent results can be interpreted.
- Track rework and follow-up. Monitor staff touches, time and unresolved claims alongside the percentage.
Keep edit performance separate from acceptance and payment outcomes. The claim submission process guide explains the wider workflow. For coverage-related exceptions, review the eligibility verification workflow rather than assuming every issue has the same cause.
What is a good benchmark?
Do not use a universal pass/fail threshold without a comparable source. Set a documented baseline and improvement target for your organization. Compare the same definition, claim population and reporting period, and record any changes to the processing system or edit rules.
How to improve your clean claim rate
- Verify eligibility before the visit
- Confirm prior authorization
- Scrub claims for coding/format errors pre-submission
- Track rejections and fix recurring causes
How automation helps
Pre-submission editing identifies claims that need correction before release. Downstream claim status automation supports payer-status research and follow-up; it does not replace a claims scrubber or guarantee payment.
Monitor clean claim rate alongside denial trends, days in AR, and collections with RCM Edge revenue cycle analytics dashboards.
Frequently asked questions
What is a good clean claim rate?
Assess the rate against a consistently measured baseline and a comparable claim population. A percentage alone does not establish the cause of an exception or guarantee payment.
How do you calculate clean claim rate?
Divide claims passing edits without manual intervention by claims accepted into the processing tool for billing, then multiply by 100.
Why does clean claim rate matter?
It helps teams monitor pre-submission edit performance. Review rework, downstream acceptance and payment separately rather than treating this metric as proof of those outcomes.
How can I improve my clean claim rate?
Validate the report, inspect exception reasons, assign owners and measure a specific workflow improvement. Review eligibility, authorization and edit issues where relevant to the exceptions.
Use clean-claim performance as an early signal, then automate status research and route unresolved payer work into focused AR queues.