REVENUE CYCLE ANALYTICS
Revenue Cycle Analytics Dashboards for Clearer RCM Decisions
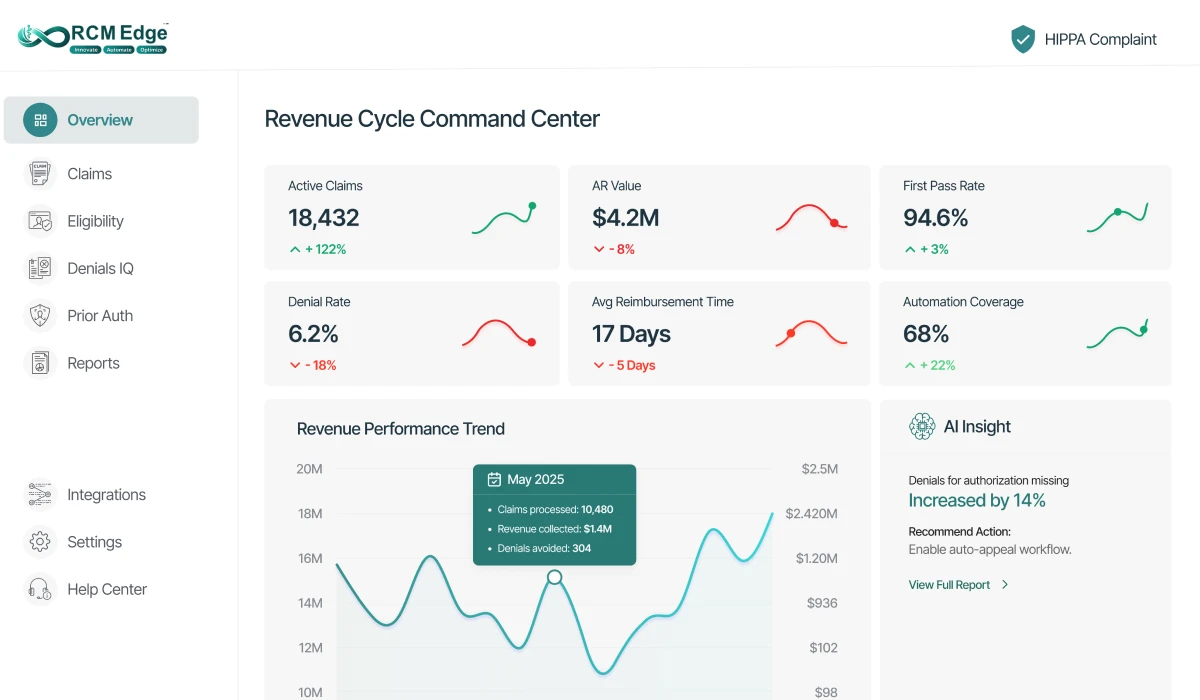
Edge Insights organizes revenue cycle workflow activity into dashboards for AR aging, denials, payer patterns, queue movement, and operational follow-up. Teams can review trends and focus attention on the exceptions that need action.
AR visibility | Denial trends | Payer patterns | HIPAA | SOC 2 Type II
THE OPERATIONAL PROBLEM
Disconnected Reports Make Revenue Cycle Performance Harder to Act On
Operational data often sits across EHR, practice-management, clearinghouse, payer, spreadsheet, and workflow tools. Teams may see totals without the context needed to decide which queue or process needs attention.
Fragmented Revenue Reporting
Staff assemble exports, reconcile definitions, and compare separate reports before leaders can investigate AR, denials, payer delays, or workload movement.
Connected Performance Visibility
Edge Insights brings agreed workflow measures into consistent dashboards so teams can review trends, investigate exceptions, and coordinate the next action.
CORE CAPABILITIES
Connect Operational Activity to Revenue Cycle Dashboards
Use consistent views across the workflows your team is automating today, then expand reporting as additional modules are connected.
Review aging concentration, queue movement, completed work, and unresolved exceptions.
Organize recurring denial reasons, payer patterns, and recovery workflow activity.
See status activity and follow-up categories within a connected claim workflow.
Review completed eligibility work and the exceptions routed for staff attention.
Track pending authorization work, decisions, and cases requiring follow-up.
Payer and Queue Patterns
Compare operational trends by payer, workflow, team, and defined work category.
HOW IT WORKS
From Workflow Activity to Focused Operational Review
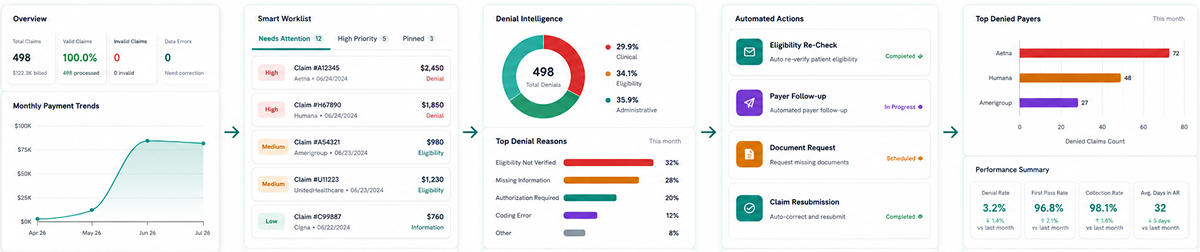
Define the measures that matter, connect the relevant workflow data, and give each team a consistent path from a dashboard signal to accountable follow-up.
01. Define the Questions
Agree on the queues, trends, exceptions, and workflow measures the team needs to review.
02. Connect Workflow Data
Bring relevant RCM workflow activity into a consistent reporting structure.
03. Review Dashboards
Monitor agreed views for aging, denials, payer patterns, statuses, and queue movement.
04. Investigate and Act
Route exceptions or recurring patterns to the staff responsible for follow-up and process improvement.
OPERATIONAL OUTCOMES
Turn Revenue Cycle Reporting Into a Repeatable Management Workflow
A shared view helps teams spend less time reconciling reports and more time investigating the operational issues behind the numbers.
Shared Definitions
Review agreed measures across leaders, analysts, and operational teams.
Earlier Visibility
Surface queue or payer patterns for investigation before the next reporting cycle.
Focused Follow-Up
Connect dashboard signals to the people responsible for the next action.
Consistent Review
Use repeatable dashboards instead of rebuilding the same report manually.
BUILT FOR YOUR TEAM
Revenue Cycle Analytics for Every RCM Operating Model
Compare workflow movement across clients, specialties, payers, and teams.
Give operational and revenue leaders a clearer view of queues, trends, and exceptions.
Create consistent performance views and governance across a larger operation.
FREQUENTLY ASKED QUESTIONS
Revenue Cycle Analytics Frequently Asked Questions
What is revenue cycle analytics?
Revenue cycle analytics organizes financial and operational workflow data into measures and dashboards that help teams review AR, claims, denials, payer patterns, queues, and follow-up activity.
Which RCM measures can a team review?
The useful measures depend on the connected workflows and agreed definitions. Common areas include AR aging, denial trends, claim-status categories, payer patterns, queue age, completed work, and unresolved exceptions.
Does Edge Insights replace our source systems?
No. It is designed to organize visibility around connected RCM workflows while the EHR, practice-management, clearinghouse, payer, and other approved systems continue to serve their defined roles.
How should we prepare for an analytics demo?
Bring the reports your team uses today, the definitions behind each measure, the decisions those reports support, and one or two workflows where missing visibility delays action.
SEE THE WORKFLOW ON YOUR DATA
See Edge Insights on Your Revenue Cycle Workflow
Bring your current reports, workflow definitions, and the questions your team cannot answer quickly today. We will map the relevant dashboard views and the path from insight to follow-up.
Let’s talk RCM
Ready to automate your revenue cycle?
Tell us where your team spends the most time. We’ll show you how RCM Edge can streamline the workflow, reduce manual follow-up, and accelerate reimbursement.

Talk with an RCM specialist
Share a few details and our team will contact you with the right next step.